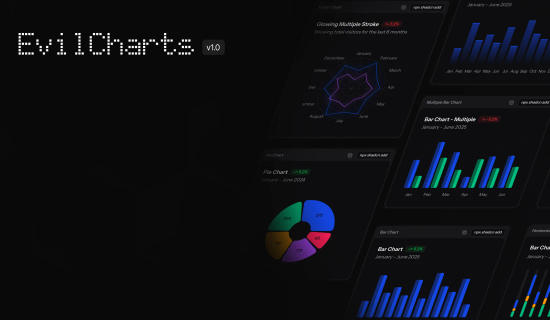
Evil Charts
Evil Charts is a library of beautiful charts components that are easy to use and customize. It is built with Tailwind CSS and React. Built on top of shadcn/recharts.
You may like

Bklit UI is a component library built on top of shadcn/ui to help you build charts and data visualizations more easily.

AntV Visualization Component Library of React.

Open-source JavaScript library designed to easily create animated data visualizations and data stories.

UI component for Globe Data Visualization using ThreeJS/WebGL.

We make it easy for developers to create charts and dashboards for web and mobile platforms.
ApexCharts is a a free and open-source modern charting library.