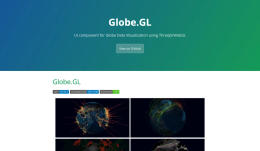
UI component for Globe Data Visualization using ThreeJS/WebGL.
Pre-built, customizable UI components ready to drop into your projects. From interactive elements to complex widgets, accelerate development with production-ready building blocks.
110 tools
UI component for Globe Data Visualization using ThreeJS/WebGL.
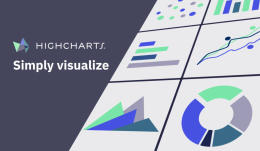
We make it easy for developers to create charts and dashboards for web and mobile platforms.
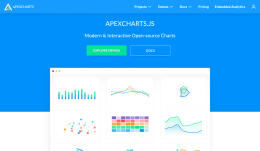
ApexCharts is a a free and open-source modern charting library.

VisActor is derived from a large number of visualization scenes of ByteDance.
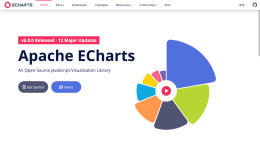
Apache ECharts, a powerful, interactive charting and visualization library for browser.
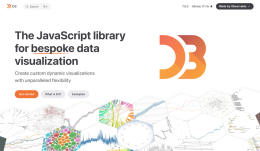
The JavaScript library for bespoke data visualization.

nivo provides a rich set of dataviz components, built on top of D3 and React.

G2Plot is an interactive and responsive charting library based on the grammar of graphics.
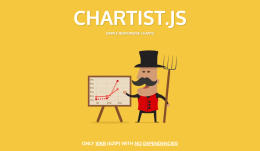
Create responsive, scalable and good looking charts with chartist.js.

Simple yet flexible JavaScript charting library for the modern web.
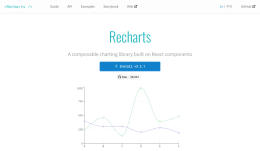
A composable charting library built on React components.

Evil Charts is a library of beautiful charts components that are easy to use and customize.